FAQ #
Each assignment will have an FAQ linked at the top. You can also access it by adding “/faq” to the end of the URL. The FAQ for Project 2a is located here.
Introduction #
In this project, we will build a browser based tool for exploring the history of word usage in English texts. We have provided the front end code (in Javascript and HTML) that collects user inputs and displays outputs. Your Java code will be the back end for this tool, accepting input and generating appropriate output for display.
A video introduction to this project can be found at this link.
To support this tool, you will write a series of Java packages that will allow for data analysis. Along the way we’ll get lots of experience with different useful data structures. The early part of the project (proj2a) will start by telling you exactly what functions to write and classes to create. The later parts (proj2b) will leave more open to your own design.
To get started, use git pull skeleton main as usual. You’ll also need to download the project 2 datafiles (not
provided via github for space reasons). You can find
them at this link. You should
unzip this
file (How to unzip folders on Windows
; How to unzip folders on Mac)
into the proj2 directory such that the “data” folder is at the same level as the “ngordnet” and “static” folders. Note
that we’ve set up hidden .gitignore files in the skeleton code so
that git will avoid uploading these data files. This is intentional. Uploading the data files to github will result in a
lot of headaches for everybody, so please don’t mess with any filed called .gitignore. If you need to work on multiple
machines, you should download the zip file once for each machine.
You should also go to the library-fa22 folder and run git pull to make sure you have all the library files you’ll
need for this project. When adding libraries to your project, select ALL libraries in the library-fa22 directory (or,
just import the directory as a whole).
If NgordnetQuery doesn’t compile, make sure you are using Java version 15 (preview) or higher (preferably 17+).
A video guide to setting up your computer for this project can be found at this link ( video now available!).
Proj2A: Building an Ngrams Viewer #
The Google Ngram dataset provides many terabytes of information about the historical frequencies of all observed words and phrases in English (or more precisely all observed ngrams). Google provides the Google Ngram Viewer on the web , allowing users to visualize the relative historical popularity of words and phrases. For example, the link above plots the relative popularity of the phrases “global warming” (a 2gram) and “to the moon” (a 3gram).
In project 2a, you will be build a version of this tool that only handles 1grams. In other words, you’ll only be able to handle individual words. We’ll only use a small subset (around 300 megabytes) of the full 1grams dataset, as larger datasets will require more sophisticated techniques than we teach in 61B.
Most of your work for project 2a will be in the ngordnet.ngrams package, though some work will also be
in ngordnet.main, as well as potentially the ngordnet.plotter package.
TimeSeries #
The first class you’ll need to write is TimeSeries.java. For this class, you will fill in the methods of
the ngordnet/ngrams/TimeSeries.java file that we’ve provided in the skeleton.
Note: there are two constructors for this class, and you must complete them both.
A TimeSeries is a special purpose extension of the existing TreeMap class where the key type parameter is
always Integer, and the value type parameter is always Double. Each key will correspond to a year, and each value a
numerical data point for that year.
For example, the following code would create a TimeSeries and associate the number 3.6 with 1992 and 9.2 with 1993.
TimeSeries ts=new TimeSeries();
        ts.put(1992,3.6);
        ts.put(1993,9.2);
The TimeSeries class provides additional utility methods to the TreeMap class which it extends:
List<Integer> years(): Returns all years in the TimeSeries.List<Double> data(): Returns all data as aList<Double>.TimeSeries plus(TimeSeries x): Returns the yearwise sum of x and this.TimeSeries dividedBy(TimeSeries x): Returns the yearwise quotient of this and x.
For example, the following code will create a TimeSeries of cat and dog populations and then compute their sum. Note
that there is no value for 1993 because that year does not appear in either TimeSeries.
TimeSeries catPopulation=new TimeSeries();
        catPopulation.put(1991,0.0);
        catPopulation.put(1992,100.0);
        catPopulation.put(1994,200.0);

        TimeSeries dogPopulation=new TimeSeries();
        dogPopulation.put(1994,400.0);
        dogPopulation.put(1995,500.0);

        TimeSeries totalPopulation=catPopulation.plus(dogPopulation);
// expected: 1991: 0,
//           1992: 100
//           1994: 600
//           1995: 500

        List<Integer> expectedYears=new ArrayList<>
        (Arrays.asList(1991,1992,1994,1995));

                assertEquals(expectedYears,totalPopulation.years());

                List<Double> expectedTotal=new ArrayList<>
        (Arrays.asList(0.0,100.0,600.0,500.0));

                for(int i=0;i<expectedTotal.size();i+=1){
        assertEquals(expectedTotal.get(i),totalPopulation.data().get(i),1E-10);
        }
You may not add additional public methods to this class. You’re welcome to add additional private methods.
Tips:
TimeSeriesobjects should have no instance variables. ATimeSeriesis-aTreeMap. That means yourTimeSeriesclass also has access to all methods that a TreeMap has, see https://docs.oracle.com/en/java/javase/17/docs/api/java.base/java/util/TreeMap.html .- The provided
TestTimeSeriesclass provides a simple test of theTimeSeriesclass. Feel free to add your own tests. Note that the unit tests we gave you do not evaluate the correctness of thedividedBymethod. - You’ll notice in the test above that we did not directly compare
expectedTotalwithtotalPopulation.data(). This is because doubles are prone to rounding errors, especially after add or especially division operations operations ( for reasons that you will learn in 61C). Thus,assertEquals(expectedTotal, totalPopulation.data());may unexpectedly return false. Instead, the code above iterates through the two lists and compares them with anepsilonof1E-10, meaning that so long as the two values are within1E-10of each other, they are considered equal. - You may assume that the
dividedByoperation never divides by zero. - You should never impute any zeroes. In other words, nowhere should you have any code which fills in a zero if a value is unavailable.
NGramMap #
The NGramMap class will provide various convenient methods for interacting with Google’s NGrams dataset. This task is
more open-ended and challenging than the creation of the TimeSeries class. As with TimeSeries, you’ll be filling in
the methods of an existing NGramMap.java file. NGramMap should not extend any class.
As an example, the code below first creates an NGramMap from the top_14377_words.csv and total_counts.csv files (
described below), then performs various operations related ot the occurrences of the word “fish” and “dog” in the period
between 1850 and 1933.
// creates an NGramMap from a large dataset
NGramMap ngm=new NGramMap("./data/ngrams/top_14377_words.csv",
        "./data/ngrams/total_counts.csv");

// returns the count of the number of occurrences of fish per year between 1850 and 1933.
        TimeSeries fishCount=ngm.countHistory("fish",1850,1933);
        assertEquals(136497.0,fishCount.get(1865),1E-10);
        assertEquals(444924.0,fishCount.get(1922),1E-10);

        TimeSeries totalCounts=ngm.totalCountHistory();
        assertEquals(2563919231.0,totalCounts.get(1865),1E-10);

// returns the relative weight of the word fish in each year between 1850 and 1933.
        TimeSeries fishWeight=ngm.weightHistory("fish",1850,1933);
        assertEquals(136497.0/2563919231.0,fishWeight.get(1865),1E-7);

        TimeSeries dogCount=ngm.countHistory("dog",1850,1876);
        assertEquals(75819.0,dogCount.get(1865),1E-10);

        List<String> fishAndDog=new ArrayList<>();
        fishAndDog.add("fish");
        fishAndDog.add("dog");
        TimeSeries fishPlusDogWeight=ngm.summedWeightHistory(fishAndDog,1865,1866);

        double expectedFishPlusDogWeight1865=(136497.0+75819.0)/2563919231.0;
        assertEquals(expectedFishPlusDogWeight1865,fishPlusDogWeight.get(1865),1E-10);
The NGramMap has the following constructors and functions you’ll need to fill in for this part:
NGramMap(String wordsFilename, String countsFilename): The constructor for a NGramMap.TimeSeries countHistory(String word): Returns yearwise count of the given word for all available years.TimeSeries totalCountHistory(): Returns yearwise count of all words for all time. This data should come from the data in the file specified bycountsFilename, not from summing all words in the file given bywordsFilename.TimeSeries weightHistory(String word): Returns yearwise relative frequency (a.k.a. normalized count) of the given word for all time. For example, if there were 100,000 words across all volumes in 1575 and 2,100 occurrences of the word “guitar”, thenweightHistory("guitar")would have a value of 2100/100000 for the year 1575. If a word does not appear in a given year, that year should not be included in the TimeSeries.TimeSeries summedWeightHistory(Collection<String> words): Returns the yearwise sum of the relative frequencies ( a.k.a. normalized counts) for the given words for all time.- Additionally, another version of
countHistory,weightHistory, andsummedWeightHistorythat take starting and ending year arguments.
Most of the work will be in the constructor, and your methods should be short, for example our weightHistory
method is 3 lines long. Make sure to pick your data structures carefully. As we saw in the Disjoint Sets lecture,
picking the wrong data structures will make your life difficult and your code slow. If you find that your methods are
very annoying to write, reconsider your data structures and try again.
You may not add additional public methods to this class. You’re welcome to add additional private methods.
Tips:
- Rather than using one of the large input files (e.g. top_14377_words.csv), we recommend starting with one of the smaller input files, either very_short.csv or words_that_start_with_q.csv.
- Our provided tests only cover some methods. And some methods are only tested on a very large file. You may need to write additional tests.
- You should never impute any zeroes. In other words, nowhere should you have any code which fills in a zero if a value is unavailable.
- If it helps speed up your code, you can assume year arguments are between 1400 and 2100.
- NGramMap should not extend any other class.
- Your methods should be simple! If you pick the right data structures, the methods are easy to implement.
The NGram Input File Formats #
The NGram dataset comes in two different file types. The first type is a “words file”. Each line of a words file provides tab separated information about the history of a particular word in English during a given year.
airport     2007    175702  32788
airport     2008    173294  31271
request     2005    646179  81592
request     2006    677820  86967
request     2007    697645  92342
request     2008    795265  125775
wandered    2005    83769   32682
wandered    2006    87688   34647
wandered    2007    108634  40101
wandered    2008    171015  64395
The first entry in each row is the word. The second entry is the year. The third entry is the number of times that the word appeared in any book that year. The fourth entry is the number of distinct sources that contain that word. Your program should ignore this fourth column. For example, from the text file above, we can observe that the word wandered appeared 171,015 times during the year 2008, and these appearances were spread across 64,395 distinct texts. For this project, we never care about the fourth entry (total number of volumes).
The other type of file is a “counts file”. Each line of a counts file provides comma separated information about the total corpus of data available for each calendar year.
1470,984,10,1
1472,117652,902,2
1475,328918,1162,1
1476,20502,186,2
1477,376341,2479,2
The first entry in each row is the year. The second is the total number of words recorded from all texts that year. The third number is the total number of pages of text from that year. The fourth is the total number of distinct sources from that year. Your program should ignore the third and fourth columns. For example, we see that Google has exactly one English language text from the year 1470, and that it contains 984 words and 10 pages. For the purposes of our project the 10 and the 1 are irrelevant.
You may wonder why one file is tab separated and the other is comma separated. I didn’t do it, Google did. Luckily, this difference won’t be too hard to handle.
Implementation Requirements and Tips #
There is a lot to think about for this part of the project. We’re trying to mimic the situation in the real world where you have some big open ended problem and have to figure out the approach from scratch. This can be intimidating! It will likely take some time and a lot of experimentation to figure out how to proceed. To help keep things from being too difficult, we’ve at least provided a list of methods to implement. Keep in mind that in the real world (and in proj2b and proj3), even the list of methods will be your choice.
Your code should be fast enough that you can create an NGramMap using top_14377_words.csv. Loading should take less than 60 seconds (maybe a bit longer on an older computer). If your computer has enough memory, you should also be able to load top_49887_words.csv.
Tips:
- Avoid using a HashMap or TreeMap as
an actual type argument
for your maps. This is usually a sign that what you actually want is a custom defined type. In other words, if your
instance variables include a nested mapping that looks like
HashMap<blah, HashMap<blah, blah>>, then aTimeSeriesor some other class you come up with might be useful to keep in mind instead. - We have not taught you how to read files in Java. We recommend using the
Inclass. The official documentation can be found here. However, you’re welcome to use whatever technique you’d like that you learn about online. We provide an example classFileReaderDemo.javathat gives examples of how to useIn. - If you use
In, don’t usereadAllLinesorreadAllStrings. These methods are slow. Instead, read inputs one chunk at a time. SeeFileReaderDemo.javafor an example.
Setting Up a Web Server to Handle NgordnetQueries #
You should only do this part when you are fairly confident that TimeSeries and NGramMap are working properly.
HistoryTextHandler #
In this final part of project 2a, we’ll do a bit of software engineering. While this content isn’t strictly related to data structures, it is incredibly important to be be able to take projects and deploy them for real world use.
-
In your web browser, open up the
ngordnet_2a.htmlfile in thestaticfolder. You can do this from your finder menu in your operating system, or by right clicking on thengordnet_2a.htmlin IntelliJ, clicking “open in”, then “ browser”. You can use whatever browser you want, though TAs will be most familiar with Chrome. You’ll see a web browser based interface that will ultimately (when you’re done with the project) allow a user to enter a list of words and get back a visualization. -
Try entering “cat, dog” into the “words” box, then click “History (Text)”. You’ll see that nothing useful shows up. Optional: If you open the developer tools in your web browser (see Google for how to do this), you’ll see an error that looks like either “CONNECTION_REFUSED” or “INVALID_URL”. The problem is that the Javascript tries to access a server to generate the results, but there is no web server running that can handle the request to see the history of cat and dog.
-
Open the
ngordnet.main.Mainclass. This class’s main first creates aHugNgordnetServerobject. The API for this class is as follows: First, we callstartUpon theHugNgordnetServerobject, then we “register” one or moreNgordnetQueryHandlerusing theregistercommand. The precise details here are beyond the scope of our class.The basic idea is that when you call
hns.register("historytext", new DummyHistoryTextHandler(ngm));, an object of typeDummyHistoryTextHandleris created that will handle any clicks to theHistory (Text)button. -
Try running the
ngordnet.main.Mainclass. The terminal output in IntelliJ might be red, but as long as you see the line:INFO org.eclipse.jetty.server.Server - Started..., the server started correctly. Now open the “ ngordnet_2a.html” file again, enter “cat, dog” again, then click “History (Text)”. This time, you should see a message that saysYou entered the following info into the browser: Words: [cat, dog] Start Year: 2000 End Year: 2020 -
Now open
ngordnet.main.DummyHistoryTextHandler, you’ll see ahandlemethod. This is called whenever the user clicks theHistory (Text)button.The expected behavior should instead be that when the user clicks “History (Text)” for the prompt above, the following text should be displayed:
   cat: {2000=1.71568475416827E-5, 2001=1.6120939684412677E-5, 2002=1.61742010630623E-5, 2003=1.703155141714967E-5, 2004=1.7418408946715716E-5, 2005=1.8042211615010028E-5, 2006=1.8126126955841936E-5, 2007=1.9411504094739293E-5, 2008=1.9999492186117545E-5, 2009=2.1599428349729816E-5, 2010=2.1712564894218663E-5, 2011=2.4857238078766228E-5, 2012=2.4198586699546612E-5, 2013=2.3131865569578688E-5, 2014=2.5344693375481996E-5, 2015=2.5237182007765998E-5, 2016=2.3157514119191215E-5, 2017=2.482102172595473E-5, 2018=2.3556758130732888E-5, 2019=2.4581322086049953E-5}
   dog: {2000=3.127517699525712E-5, 2001=2.99511426723737E-5, 2002=3.0283458650225453E-5, 2003=3.1470761877596034E-5, 2004=3.2890514515432536E-5, 2005=3.753038415155302E-5, 2006=3.74430614362125E-5, 2007=3.987077208249744E-5, 2008=4.267197824115907E-5, 2009=4.81026086549733E-5, 2010=5.30567576173992E-5, 2011=6.048536820577008E-5, 2012=5.179787485962082E-5, 2013=5.0225599367200654E-5, 2014=5.5575537540090384E-5, 2015=5.44261096781696E-5, 2016=4.805214145459557E-5, 2017=5.4171157785607686E-5, 2018=5.206751570646653E-5, 2019=5.5807040409297486E-5}
To pass on the autograder, the formatting of the output must match exactly.
- All lines of text, including the last line, should end in a new line character
- All whitespace and punctuation (commas, braces, colons) should follow the example above
These numbers represent the relative popularity of the words cat and dog in the given years. Due to rounding
error, your numbers may not be exactly the same as shown above. Your format should be exactly as shown above,
specifically the word, followed by a colon, followed by a space, followed by a string representation of the
appropriate TimeSeries where key value pairs are given as a comma separated list inside curly braces, with an equals
sign between the key and values. Note that you don’t need to write any code to generate the string representation of
each TimeSeries, you can just use the toString method. Note: On 10/12/2022 the example above was modified to reflect
the numbers you’d get if you use top_14377_words.csv.
- Now it’s time to implement the HistoryText button!
- Create a new file called
HistoryTextHandler.javathat takes the givenNgordnetQueryand returns a String in the same format as above. - Modify the
Main.javaso that yourHistoryTextHandleris used when someone clicksHistory (Text). In other words, instead of registeringDummyHistoryTextHandler, you should register yourHistoryTextHandlerclass instead.
Tips:
- The constructor for
HistoryTextHandlershould be of the following form:public HistoryTextHandler(NGramMap map). - Use the
DummyHistoryTextHandler.javaas a guide, pattern matching where appropriate. Being able to tinker with example code and bend it to your will is an incredibly important real world skill. Experiment away, don’t be afraid to break something! - For project 2a, you can ignore the
kinstance variable ofNgordnetQuery. - Use the
.toString()method built into theTimeSeriesclass that gets inherited fromTreeMap. - For your
HistoryTextHandlerto be able to do something useful, it’s going to need to be able to access the data stored in yourNGramMap. DO NOT MAKE THE NGRAM MAP INTO A STATIC VARIABLE! This is known as a “global variable” and is rarely the appropriate solution for any problem. Hint: YourHistoryTextHandlerclass can have a constructor.
HistoryHandler #
The text based history from the previous section is not useful for much other than autograding your work. Actually using our tool to discover interesting things will require visualization.
The ngordnet.main.PlotDemo provides example code that uses your NGramMap to generate a visual plot showing the
relative frequency of the words cat and dog between 1900 and 1950. Try running it. If your NGramMap class is correct,
you should see a very long string printed to your console that might look something like:
iVBORw0KGg...
This string is a base 64 encoding of an image file. To visualize it, Google “base64 image decode”. At the time of this writing, the top search result was for a site called codebeautify.org. Copy and paste this entire string into the website and you should see a plot similar to the one shown below:
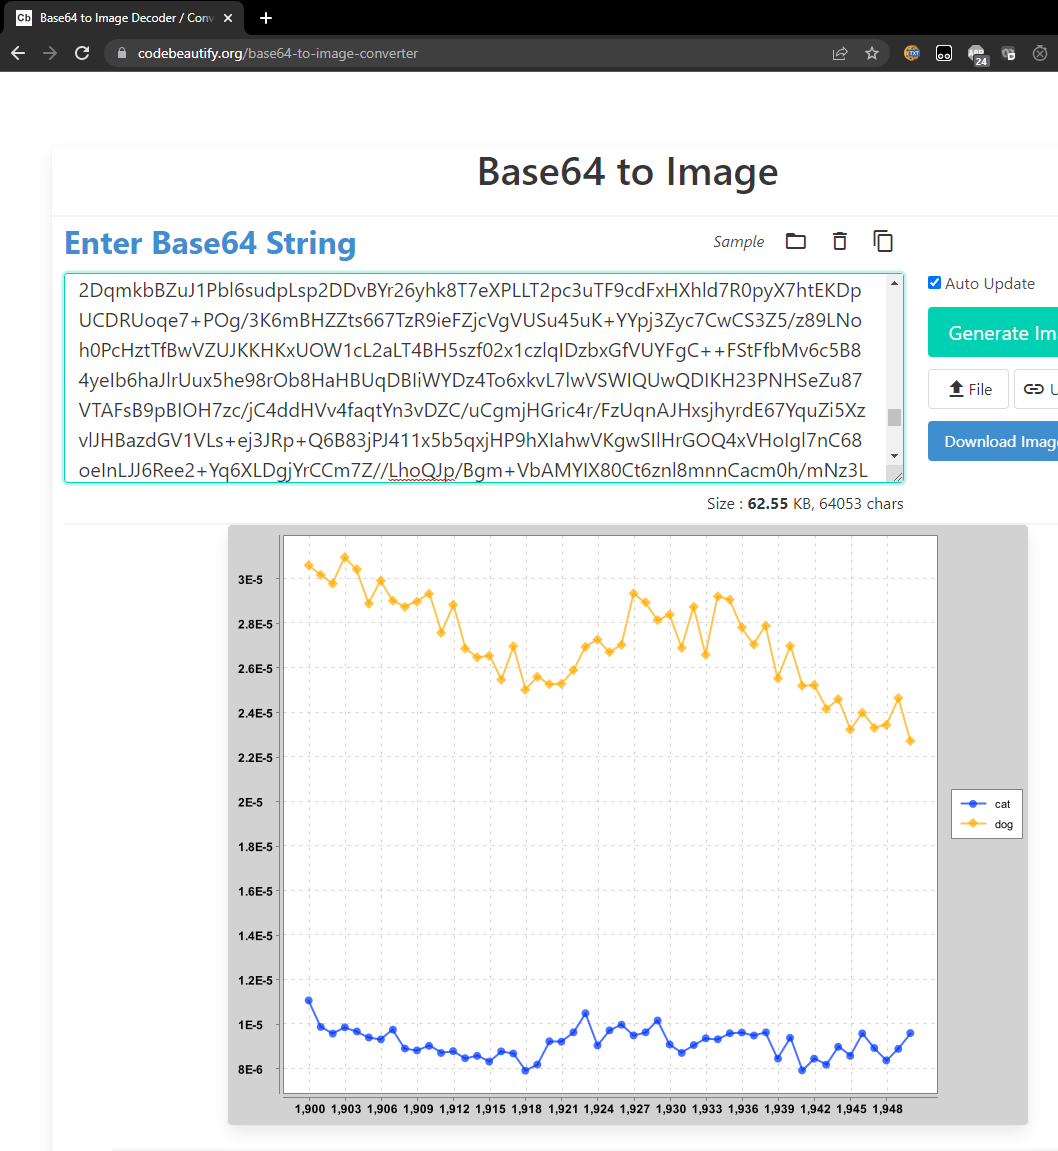
What’s going on here? The string your code printed IS THE IMAGE. Keep in mind that any data can be represented as a string of bits. This website knows how to decode this string into the corresponding image, using a predefined standard.
If you look at the plotting library, this code relies on the ngordnet.Plotter.generateTimeSeriesChart method, which
takes two arguments. The first is a list of strings, and the second is a List<TimeSeries>. The TimeSeries are all
plotted in a different color, and each is assigned the label given in the list of strings. Both lists must be of the
same length (since the ith string is the label for the ith time series).
The ngordnet.Plotter.generateTimeSeriesChart method returns an object of type XYChart. This object can in turn
either be converted into base 64 by the ngordnet.Plotter.encodeChartAsString method, or can be displayed to the screen
directly by ngordnet.Plotter.displayChart.
In your web browser, again open up the ngordnet_2a.html file in the static folder. With your ngordnet.main.Main
class running, enter “cat, dog” into the “words” box, then click “history”. You’ll see the strange image below:
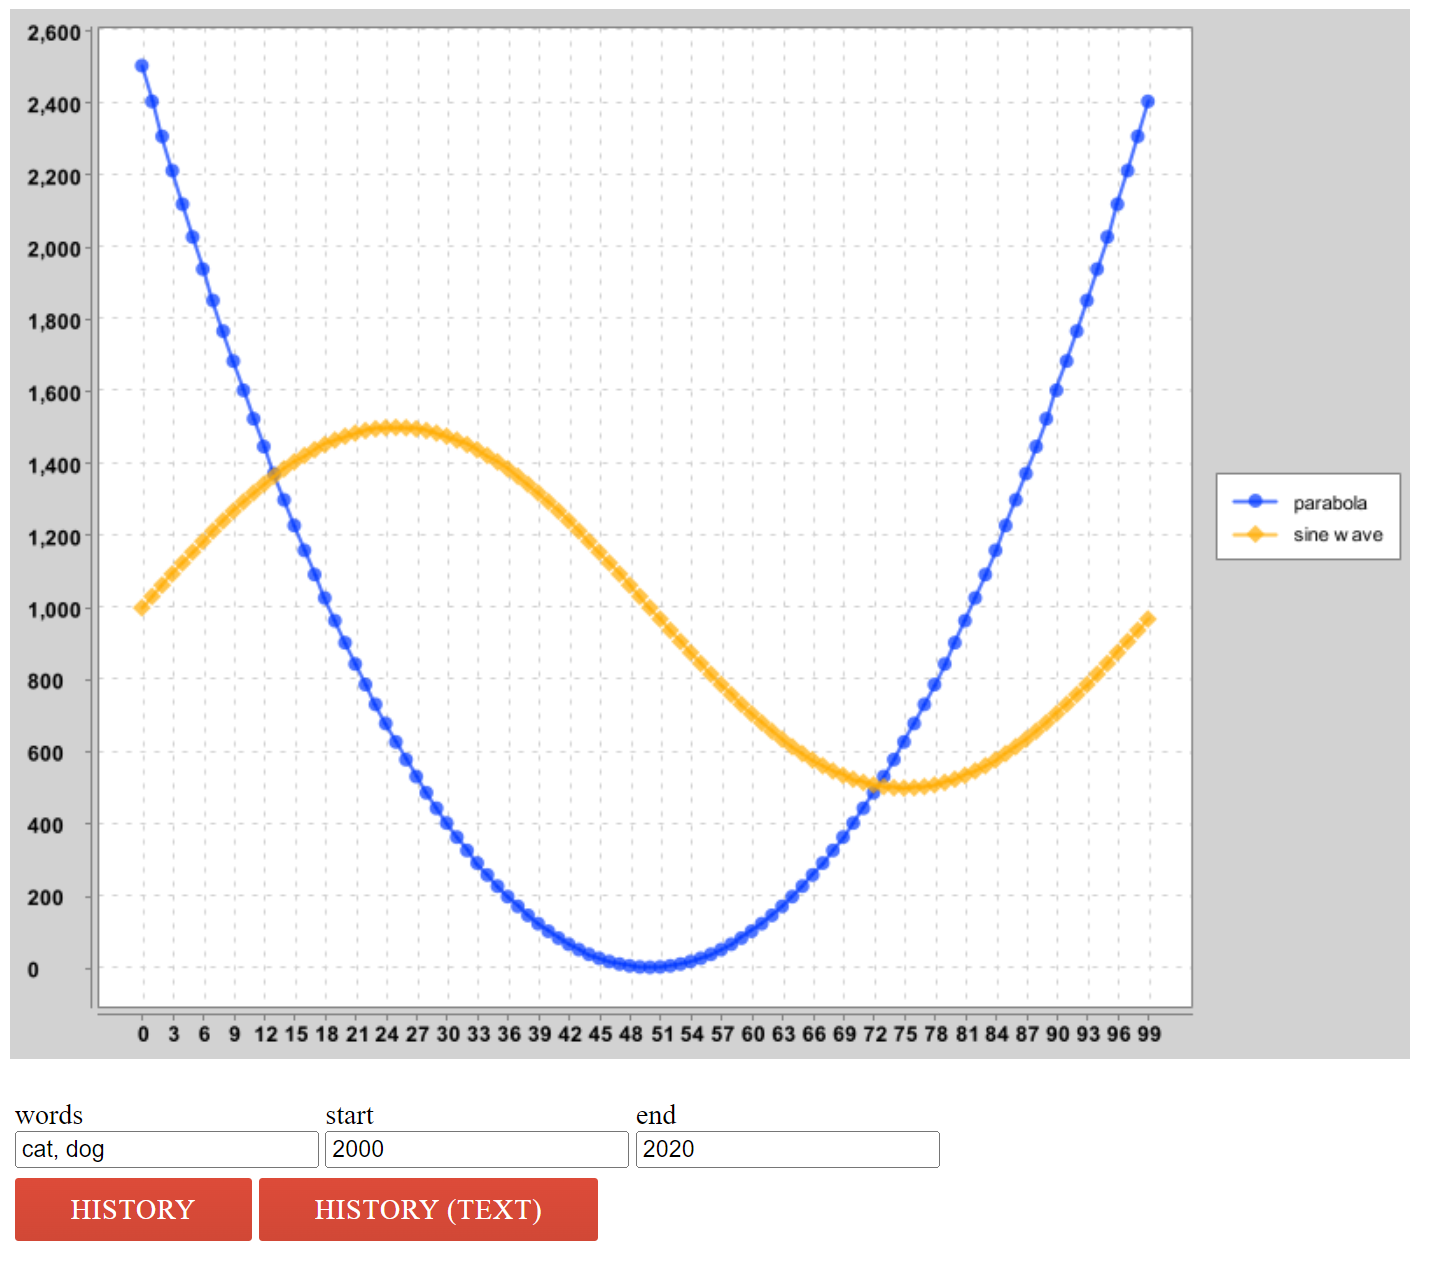
You’ll note that the code is not plotting the history of cat and dog, but rather a parabola and a sinusoid. If you
open DummyHistoryHandler, you’ll see why.
To finish up project 2A:
- Create a new file called
HistoryHandler.javathat takes the givenNgordnetQueryand returns a String that contains a base-64 encoded image of the appropriate plot. - Modify the
Main.javaso that yourHistoryHandleris called when someone clicks the “History” button.
Tips:
- The constructor for
HistoryHandlershould be of the following form:public HistoryHandler(NGramMap map). - Just like before, use
DummyHistoryHandler.javaas a guide. As mentioned in the previous section, we really want you to learn the skill of tinkering with complex library code to get the behavior you want.
Deliverables and Grading #
You are responsible for implementing four classes:
TimeSeries.javaNGramMap.javaHistoryTextHandler.javaHistoryHandler.java
Project 2a is worth 800 points. You will get 3 autograder tokens every 24 hours for the duration of the project; this is intentionally restrictive in order to encourage you to write your own unit tests by following the templates that we’ve included with the skeleton.
Acknowledgements #
The WordNet part of this assignment is loosely adapted from Alina Ene and Kevin Wayne’s Wordnet assignment at Princeton University.